
Most site owners treat website speed like a utility bill: they know it costs them money when it’s too high, but they rarely read the statement line by line. Google PageSpeed Insights hands you that statement, translated into clear, measurable numbers that affect revenue. The free tool runs a set of synthetic tests, grades each page on a 0-100 scale, and returns specific, prioritized advice. Because Google ties those grades to search rankings and ad quality scores, a mediocre result moves straight to the profit-and-loss column.
Teams often don’t realize how much even a one-second delay can cut conversions until they watch live analytics during a sale. Developers focus on new features while legacy scripts, bloated themes, and uncompressed images pile up. Google PageSpeed surfaces this kind of technical debt in minutes.
But the report alone won’t grow revenue. You still need to read the data, translate it, and act. Below, we’ll walk through the metrics that matter, the issues PageSpeed flags most often, and the specific actions that turn red numbers green. If you’d rather hand the heavy lifting to specialists, our enterprise hosting for WordPress makes many of these fixes automatic through server-side caching, image optimization, and a well-tuned PHP stack. For those who prefer to handle it in-house, keep reading; the next ten minutes will give you a practical plan to boost your PageSpeed score.
Understanding PageSpeed metrics
What are Core Web Vitals?
Google groups its most influential user-centric metrics under the Core Web Vitals label. Think of them as the “vital signs” on a patient chart: if they stay in range, the session feels fast; if they spike, users bounce.
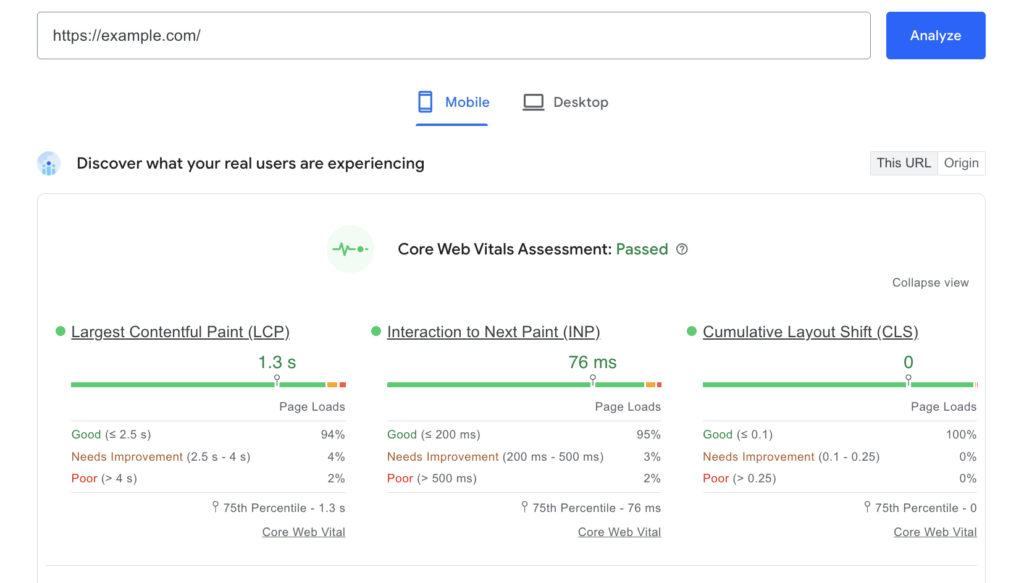
- Largest Contentful Paint (LCP) measures how long it takes the biggest visible element—often a hero image or heading—to render. Google wants to see it under 2.5 seconds on mobile because that aligns with the average user’s patience threshold.
- Interaction to Next Paint (INP) captures the full interaction timeline, giving a clearer view of real-world responsiveness. It observes the latency of all interactions a user has made with the page, and reports a single value which all (or nearly all) interactions were beneath.
- Cumulative Layout Shift (CLS) quantifies how much content jumps around as assets load. High CLS ruins trust; nothing says “your credit card is safe” like a purchase button that slides out from under a finger. Google defines a passing CLS as below 0.1.
Beyond those vitals, PageSpeed Insights reports ancillary metrics:
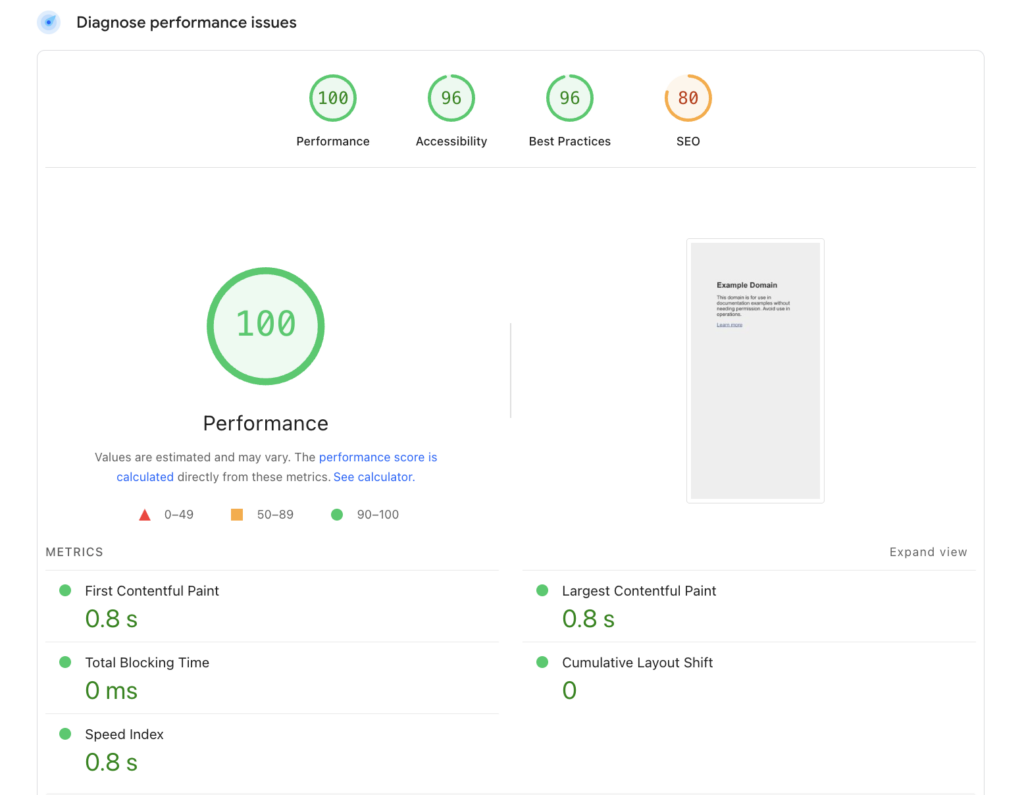
- First Contentful Paint (FCP) – Measures the duration from the moment the user first visits the page until any part of the page’s content appears on the screen.
- Time to First Byte (TTFB) – Measures the time it takes from when a resource is requested to when the first byte of the response starts arriving.
- Total Blocking Time (TBT) – Measures the total time after FCP during which the main thread was sufficiently blocked to impact input responsiveness.
- Speed Index
These diagnose deeper server or JavaScript issues. Lower is always better, but your business case should dictate acceptable trade-offs. For instance, a SaaS platform with heavy scripting may accept a slightly higher TBT if it maintains a sub-2-second LCP and keeps churn low.
Interpreting your PageSpeed score
The 0-100 grade is a weighted composite taken from the metrics above, but stakeholders often misread it. A 90-plus “green” score is ideal, yet chasing perfection can burn hours with diminishing returns. Focus first on scores under 50, where Google sees the page as slow.
PageSpeed shows both “Field Data” and “Lab Data.” Field represents real user measurements pulled from the Chrome User Experience Report. Lab data comes from Lighthouse running under warmed-up conditions on Google hardware. If field data is red while lab data is green, your hosting likely struggles under traffic spikes. That mismatch is a flashing sign you need automatic scaling or a high availability solution.
Each audit item carries an estimated savings in seconds or kilobytes. Prioritize tasks with the largest time savings that fall within your team’s skill set. For example, eliminating render-blocking resources might shave 1.5 seconds, while minifying CSS only saves 50 milliseconds. Pick the low-effort, high-impact wins first.
Finally, remember that PageSpeed measures the individual URL tested. If you template large parts of your site, fix issues once in the theme or plugin, then retest a handful of pages to confirm the improvement propagated. Version-control your theme or container images so you can roll back if metrics worsen.
Common issues identified by Google PageSpeed
Render-blocking resources
CSS files and synchronous JavaScript that sit in the head section halt HTML parsing until they finish downloading. On mobile networks that can mean several hundred milliseconds of idle time. Solutions range from inlining critical CSS to deferring non-essential scripts with the “async” or “defer” attribute.
On the hosting side, HTTP/2 pushes can shorten round-trip delays, but premature pushing wastes bandwidth. A smarter approach is server-side critical CSS extraction combined with a caching layer so that the first byte already contains the styles required for the above-the-fold layout.
Image optimization
Google flags images that are larger than necessary, uncompressed, or served in legacy formats. WebP or AVIF usually cut file sizes by 25-50% without any noticeable loss in quality. Responsive srcset attributes ensure mobile devices don’t download desktop-sized hero shots.
Plugins can automate compression, yet many work post-upload, meaning authors still wait on bloated images during previews. Offload the heavy lifting to the server: Our PressTHUMB drop-in service allows you to generate and serve optimized images automatically on the fly. By appending the requested file name with additional parameters such as the image dimensions, PressThumb will modify generate an optimized copy of the image and serve it directly to the visitor, without any additional user intervention. For businesses with thousands of SKUs, that’s hours saved and terabytes avoided each month.
How to improve your Google PageSpeed score
Minifying CSS, JavaScript, and HTML
Minification strips whitespace, comments, and redundant code. It won’t fix fundamental delays, but it trims payload size enough for meaningful gains. Build-time tools like esbuild or webpack do this seamlessly; WordPress plugins can handle it too, though they add overhead. Consider integrating minification into the CI pipeline so your developers catch syntax errors before production. If you run multiple micro-frontends, a shared library of minified assets keeps cache hit rates high, reducing TTFB.
Leveraging browser caching
Versioned static files with long Cache-Control max-age load mostly from local storage for repeat visitors. That slashes RTT, a major cost for global audiences. Set far-future expiry headers for images, fonts, and third-party scripts you control, then invalidate them through hash-based file names when updated.
At the server level, our fleet runs Amazon CloudFront at the edge, so cached files travel from a node near the user rather than your origin. Businesses gain dual benefits: lower latency and reduced origin-server costs.
The importance of mobile optimization
Mobile devices now drive the majority of website traffic, yet user engagement still lags behind desktop in metrics like bounce rate. Google’s crawler now indexes mobile first, so scores there dictate organic reach. Responsive design is only the start. Compress text with Brotli, lazy-load offscreen images, and prioritize touch-friendly elements to improve INP.
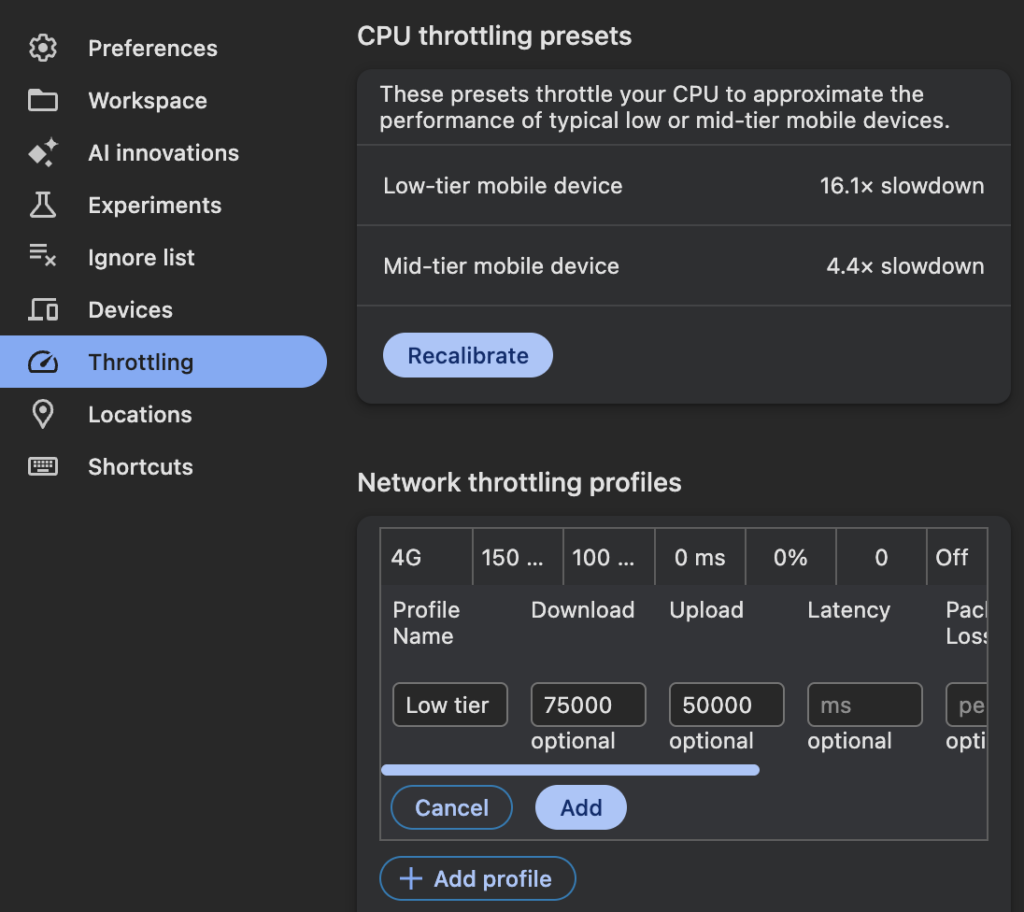
Don’t ignore hardware differences either. The performance of a modern Mac could hide script inefficiencies that a budget Android would reveal immediately. If your brand relies on time-sensitive actions (concert tickets, flash sales, etc.), throttle your local network to 400Kbps during QA. Slow UX erodes trust faster than any marketing campaign can rebuild it.
From a business standpoint, a smoother mobile experience lowers paid-ads CPC and increases the quality score, stretching every marketing dollar. Invest in a performant theme or a managed host with device-aware optimization.
Using Google PageSpeed Insights effectively
Continuous monitoring and regular updates
PageSpeed is not a one-and-done task. WordPress updates, plugin releases, ad scripts, and even browser changes affect metrics weekly. Set up scheduled Lighthouse runs via GitHub Actions or Google Cloud Functions, then post results to Slack so the team sees regressions immediately.
For enterprise sites, tie PageSpeed thresholds to deployment gates. If LCP rises above 2.5 sec in pre-prod, block the merge until it’s fixed. Automated quality controls cost less than post-launch firefights. Pagely customers often pair this with our Premium WordPress Support, letting our engineers weigh in before a new feature tanks performance.
Conclusion
Google PageSpeed Insights distills complex performance data into a score every stakeholder understands. Yet the score itself doesn’t move revenue; the fixes do. Compress images, defer render-blocking scripts, extend browser caching, and keep Core Web Vitals within Google’s green zone. Most steps are iterative, but the gains compound: better search rankings, higher conversions, and reduced spend.
If your team lacks the hours (or the appetite for server-level tuning), consider letting Pagely shoulder the heavy lifting. Our High Availability plans combine tuned PHP workers, edge caching, automatic image optimization, and 24/7 engineering support. That means you focus on product, while we chase milliseconds.Ready to see how much faster your WordPress site can run? Start by reaching out through our contact form, or compare plans to find the stack that aligns with your growth targets. Either way, make website speed a board-level metric, not an afterthought.