You know when you've written an awesome blog post about optimizing #WordPress sites for speed but can't figure out the right title for it because you don't want it to sound all clickbatey?
That's us right now.
— Pagely (@Pagely) November 12, 2020
Across the various WordPress community groups and forums, there’s no doubt that page load times are a hot topic. Amateurs and professionals alike are always trying to squeeze out every ounce of speed they can. Although most of the questions regarding sluggish page load times come from new site owners, even seasoned professionals will chime in occasionally.
Most of the time, questions about site performance and page load times follow a pretty typical pattern. It starts with someone saying that their WordPress site is slow, asking how to fix it, and providing a link to a GTMetrix or Google PageSpeed Insights report. What typically follows is widely varying recommendations for plugins, caching, CDNs, and hosting.
Unfortunately, many of the recommendations only scratch the surface. They’re vague, provide a blanket solution, or don’t address the root cause whatsoever. Even when someone makes a proper assessment and offers a solution, it rarely explains how they came to that conclusion or addresses the root problem. It’s just left with a band-aid answer. Thus, the cycle continues.
The purpose of this post is to provide a starting point for evaluating and investigating site performance, specifically when it comes to page load times. It’s not a promise of 1-click results or any magic solution. It’s intended to provide a more in-depth explanation of how to identify issues, why they happen, and how to fix them.
Let’s jump in!
A Practical Example
Let’s get started by using a practical example to investigate. For this, I’m using my friend Erik’s website. Since he’s technically inclined but doesn’t have any former WordPress experience, his site makes is a great example mix of right decisions and happy accidents.
He has a website called FunkyBop, where he sells themed mystery boxes. While it’s not noticeably slow, it’s also not very fast either. Let’s see if we can figure out what’s holding it back and squeeze out some extra speed.
Locating Problematic Pages
We’re going to start by identifying which pages and content types need the most improvement. Locating the slowest content from the very beginning not only helps improve the average across the site, but it’s also the lowest hanging fruit. Additionally, there’s a high chance that these improvements will affect other pages that share the same elements.
For this site, I’ve broken it up into a few different content types:
- Home page
- Shop landing page
- Product category page
- Single product page
Let’s go ahead and test them using GTMetrix:
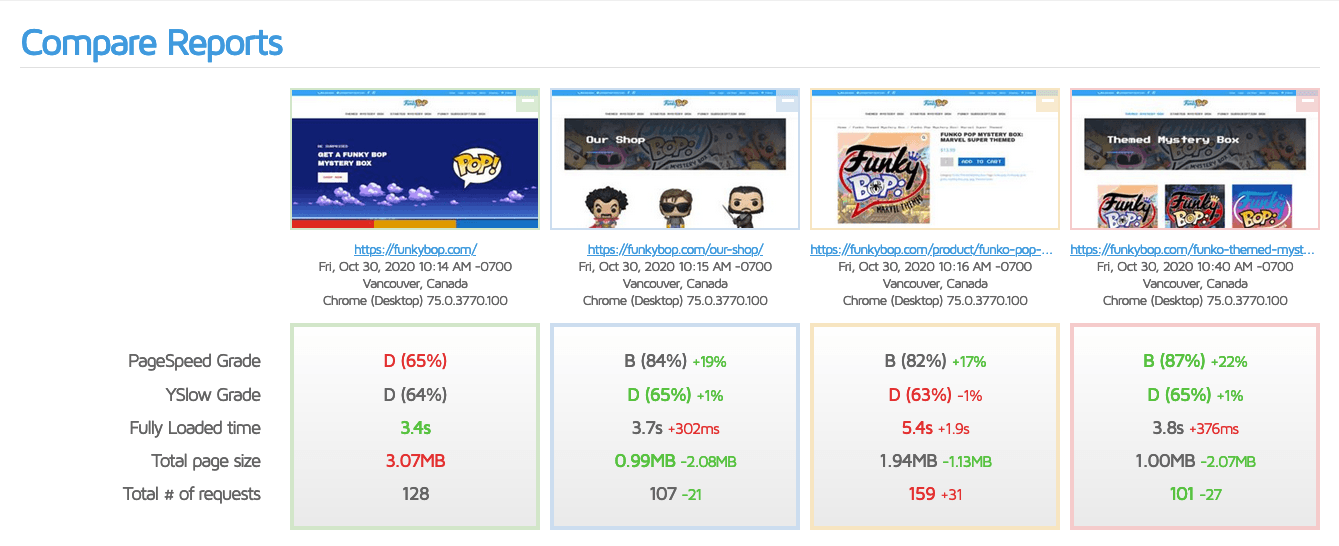
From here, we can see that most of the pages load somewhere around 3.5 seconds, but one particularly stands out — the single product page, which loads in 5.4 seconds.
It looks like we’ve found our starting point. Let’s start digging around!
Investigating Factors, Not Grades
The first thing that people usually notice is the PageSpeed and YSlow grades. They’re easy to read and provide a target to achieve.
While these grades can be useful for a broad picture, they ultimately exist as general suggestions, not rules. I’ve seen countless posts from people who get an “A” grade but still wonder why their site is still slow. Just because you’re checking off a list of general guidelines doesn’t mean that everything is ideal.
On the product page that we’re working on improving, let’s look at a few key factors.
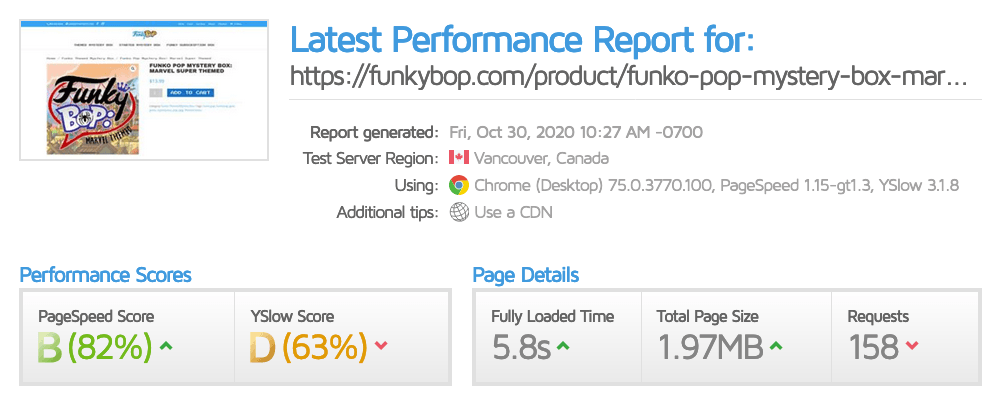
The first is the total page size, which is 1.94MB. That’s certainly not bad for most sites. But what we do see here is a large number of requests happening to load that ~2MB of data. 158, to be exact. Let’s take a more in-depth look in the next section to see if that’s making a difference.
Digging Through the Waterfall
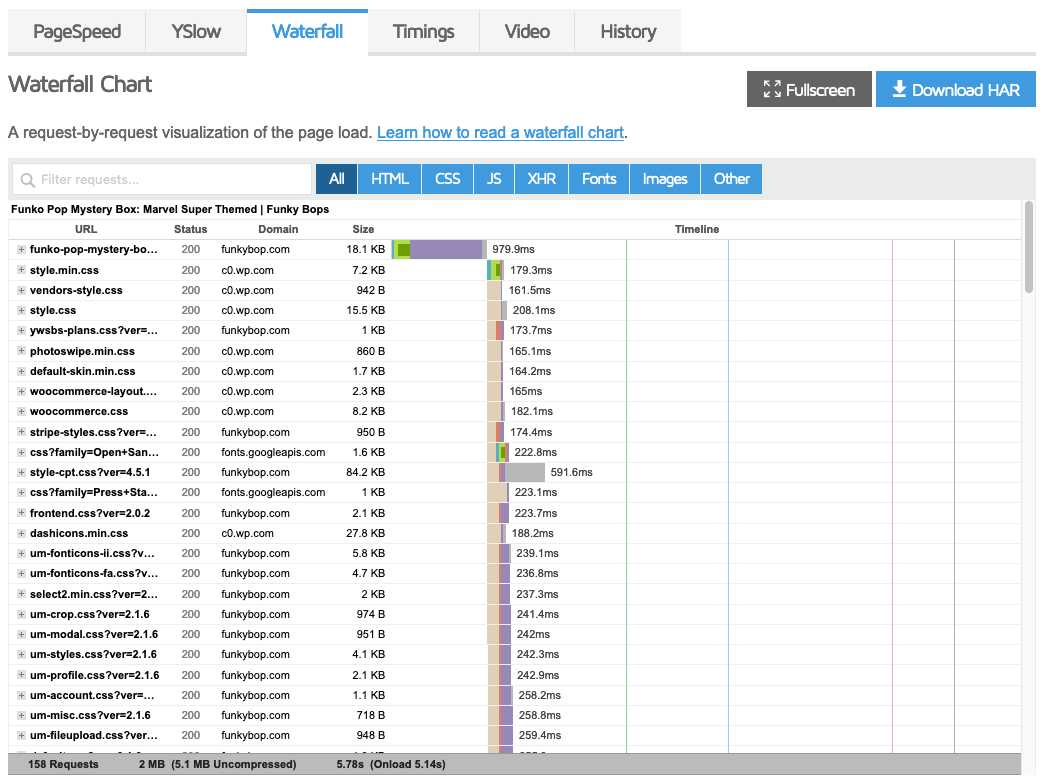
To investigate the requests that are happening when someone visits the page, we can look at the waterfall chart. This chart allows us to see what requests happen, when they occur, and how long different segments take.
Initial Request Time
The first thing that sticks out when we test this site is the initial request. After the page is requested, it’s taking almost a full second before it’s delivered by the server, not including additional resources, such as images, styles, or scripts. That’s certainly not good.
Why is it taking so long? You’ll notice that the bar on the timeline is color-coded. This color-coding allows us to easily see what portions of the request take different amounts of time.
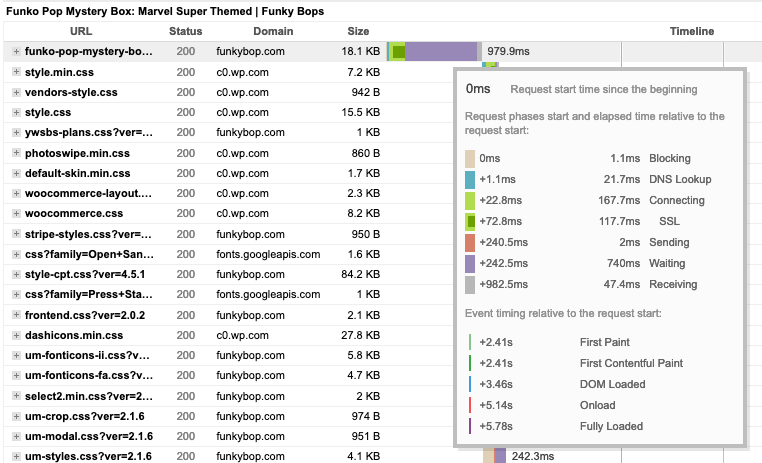
The purple section is the time spent after the server has received the request and the browser is waiting for a response. On this page, our browser is just sitting there, twiddling its thumbs for 740 milliseconds. From here, we can assume that there’s either a backed up worker queue on the server, lots of heavy code being processed, a slow database query, or a combination of all three.
Although we won’t go into all of the endless details of performance testing your code, we can at least attribute some of the slowness to the initial request.
Timeline Steps
Within the timeline, you’ll notice several vertical lines. These lines correspond with different steps that take place while the browser is rendering a page. Here’s a quick overview of those steps:
- First Paint: Marks the point when the browser has started rendering anything on the page.
- DOM Loaded: Marks when the browser has determined that the page is ready to start displaying.
- Onload: Marks the moment when the browser has finished downloading everything.
- Fully Loaded: Occurs 2 seconds after the last request completes, and the page is ready for consumption.
At this phase of our investigation, we want to look at two things: First Paint and DOM Loaded. Since the browser isn’t displaying anything until the first paint, improvements in these stages have the most significant impact on user experience.
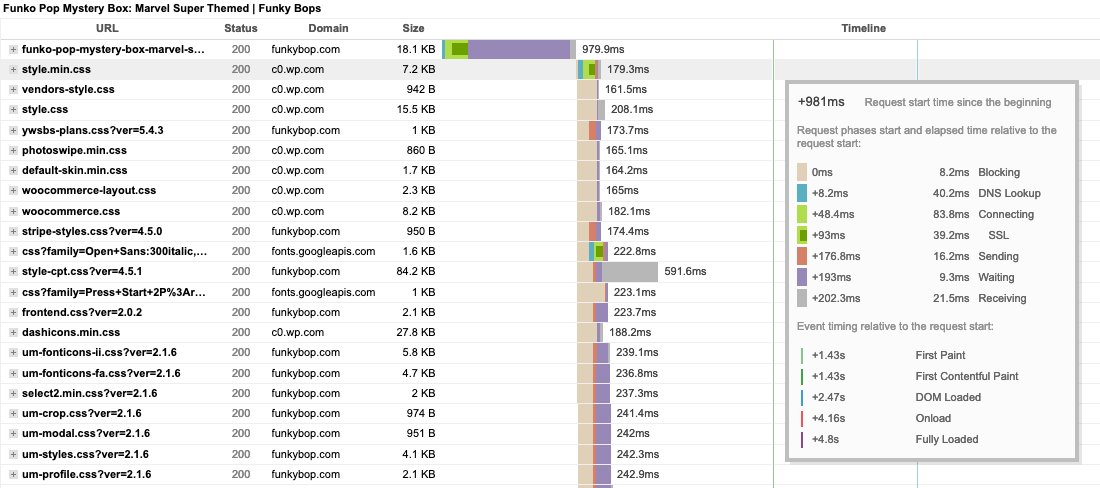
If we look at all of the items that happen before the first paint occurs, we see a significant amount of CSS and JavaScript files being downloaded and processed from multiple different sources. Although HTTP/2 uses multiplexing to download multiple items simultaneously to achieve faster load times, browsers will still enforce limitations on the number of things that they can process at once. If it hits the limit, it won’t process the next item until another has finished.
Key elements to look at are how long other tasks block the item and how long the browser is waiting for a server response. Since these are static files, the wait time should usually be minimal; regardless of the queue and file size. But as we see here, many of the assets are waiting over 100ms for the server to respond. Combining that with the resource queue filling up, we have a pretty good chunk being added to the page load time — almost 1.5 seconds!
Investigating Excess Assets
So far, we’ve identified several issues. We’ve determined that the initial page load and several static assets suffer from a slow server response time. We’ve also discovered that there are quite a few different scripts and styles being loaded. Both of these issues combined are exacerbating each other, leading to long page load times.
While those issues are the most problematic for this particular example, there are still a few more things we’ll want to check on before we can say that the problems have been thoroughly investigated.
Locating Excessive Image Assets
One of the most common things that people run across when facing slow page load times is un-optimized images. Since WordPress is so approachable, non-technical users tend to upload images that are significantly larger than necessary.
By looking at the waterfall chart, we can see all of the resources being loaded. If we sort by images, we can quickly get a look at what images are retrieved and the timings associated with them.
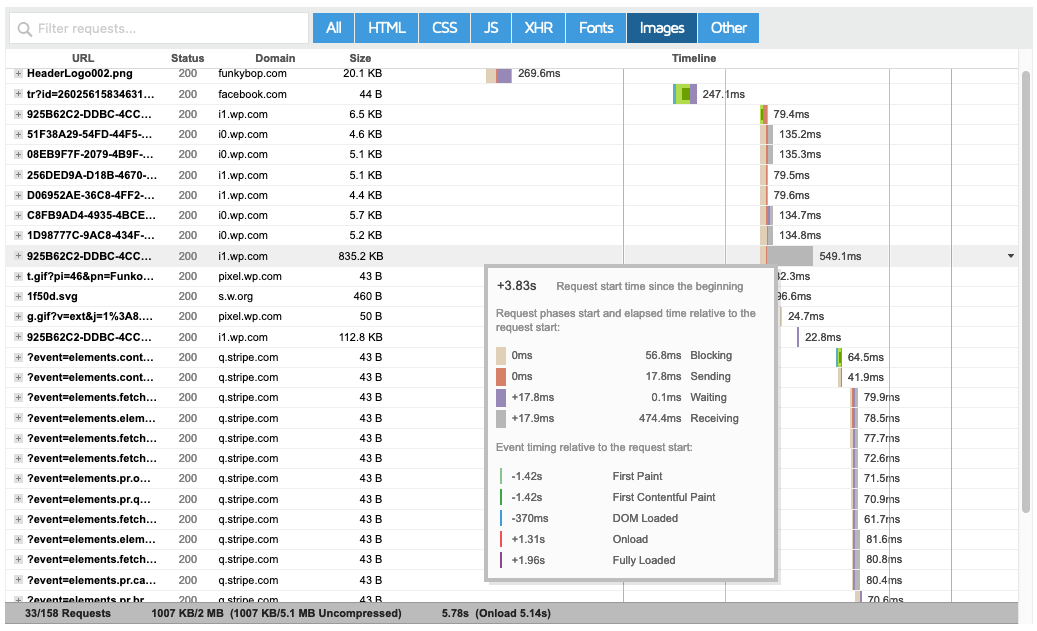
In this example, the site owner has done a pretty good job of keeping images small, but with one exception – one of his product images is way too large in both file size and dimensions. Clocking in at 835 KB for a 2160×2160 image, it can easily be reduced by over 50% with just some simple resizing and resampling — all without any perceived quality loss.
Identifying Unnecessary Fonts
When looking through the resources that are being loaded on the site, another thing that I noticed was that 10 of the requests are for font files.

Although these requests are processed quickly, they’re still extra requests that the browser needs to send and wait for a response. If there are any unused or redundant font files being loaded, it’s always a good idea to remove them.
Where to Go from Here
Analyzing slow page load times on a WordPress site takes a fair bit of knowledge and time to look into, but it’s well worth the effort. While we couldn’t possibly go over every aspect of investigating the various items that contribute to sub-par page load times, I hope that I’ve equipped you with enough information about why your pages might be loading slowly.
Stay tuned! In part 2 of this segment, we’ll take a deep dive into this site, resolve the issues, and provide more information on how we fixed them!
