
Pagely Platform Integrations
EXPAND AND ENHANCE YOUR PAGELY SERVICE

Visualize Your WordPress Site Statistics with Grafana
Integrate Grafana with Pagely
Grafana is a widely-used solution for visualizing your data in the way that works best for you and your team. By utilizing Grafana, you can see all of your data at a glance, with minimal effort.
Due to Grafana being a visualization tool, rather than an all-in-one solution, you can source data from a limitless number of sources. This means that regardless of where your data lives, it can be combined into a visual representation of the things you need to know.
Unified Monitoring
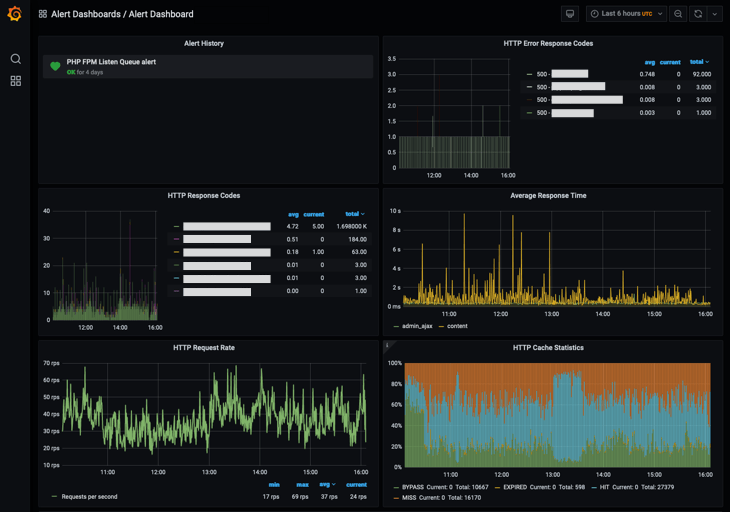
Fumbling through huge datasets across different sources is annoying. Grafana simplifies that process by using dashboards with simplified data visualization. You can see things like your response times, error codes, and cache statistics with at a glance.
Even while using using external logging services, such as LogEntries or DataDog, you can always find what you need.
Simple Setup
We want to help you manage WordPress and everything else in your stack with ease. Our experts are happy to install Grafana for you, help set up data sources, and configure graphs that show the data you need.