
Google Analytics is a wonderful tool. It provides insight into your traffic, visitor behavior, and your conversions. All your digital efforts housed within a treasure trove of data and information. But, what good is that data if not viewed in any meaningful kind of way?
Enter: Dashboards.
Dashboards are purpose-built visualizations of your Google Analytics data.
You’re given the ability to create and customize up to 20 dashboards per user account. And aside from making your data more accessible, it makes it much nicer to look at. In this post, we’ll guide you through planning your dashboards and how to build your own.
The Game Plan
To get the most out of your dashboards you’ll need to consider two things:
- Key Metrics
- Timing
Before building your data-analytics machine, you need to consider what you’ll be tracking. You need to differentiate between vanity metrics and key metrics.
How?
By considering your business objectives and their associated KPIs.
Key metrics are accurate predictors of the achievement of these goals. For example, if you’re in higher education and looking to increase student turnout at your next event, you can track specific landing pages, brochure downloads or total event sign-ups.
It’s about identifying the pertinent information that requires regular observation.
Timing is Everything
The next thing to consider is the date range you’ll be displaying your data in and the timing of your reports. Why? Because achieving KPIs, more often than not, will have time boundaries.
Once you’ve built your dashboard, you’ll need to set timing intervals on how often reporting will occur. This can differ per metric. You may want to track your organic search traffic weekly, while your landing page sign-ups, monthly for example.
Again, these are relative to your organization’s business objectives. Remember that consistent timing will allow you to compare data across different periods.
Build It and They Will Come
Once you’ve decided on what you’ll track and how often you want to know about them – it’s time to start building! Here’s how.
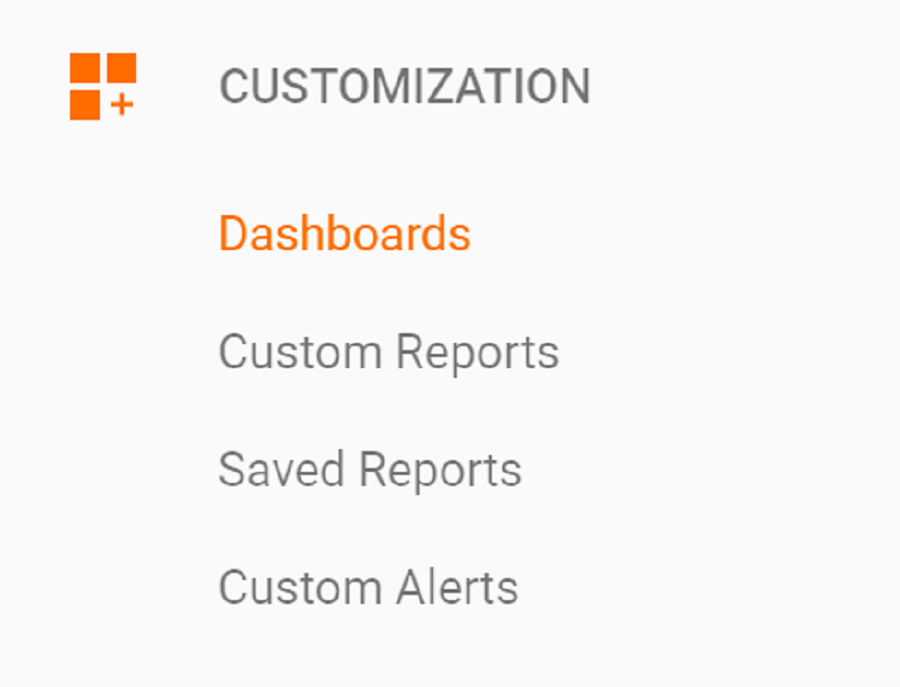
From your Google Analytics left-side menu click Customizations and then Dashboards:
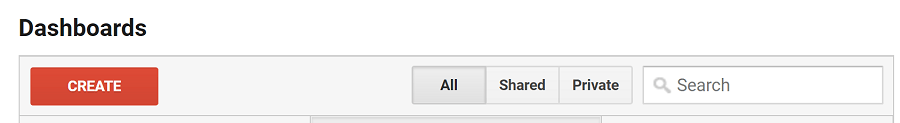
Then to start, click the red Create button:
You’ll be given two options: Blank Canvas and Starter Dashboard. If this is your first time building a dashboard and you just want to get up and running, go with Starter Dashboard.
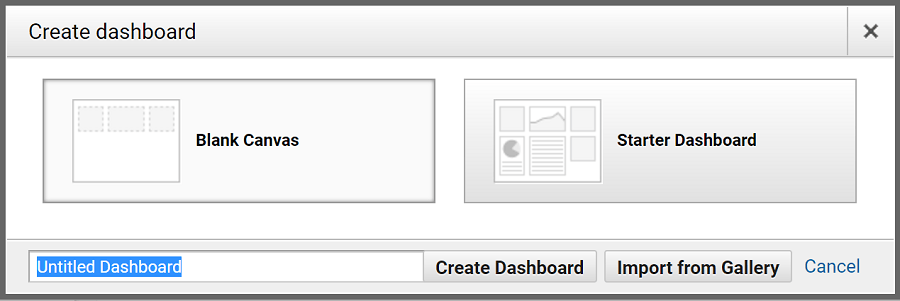
Give it a name, click Create Dashboard and you’re on your way! You’ll now be looking at your very first dashboard, complete with your own data-filled widgets. But, you didn’t do all that planning for nothing – it’s time to customize.
Now, you can add a new widget by clicking the button in the top left corner. Or, since a new dashboard will come with preloaded widgets, you can start by customizing those.
There are two buttons that appear at the top right when you hover your mouse over any widget:

Clicking the X will remove it from your dashboard. The pencil opens up the customization options:
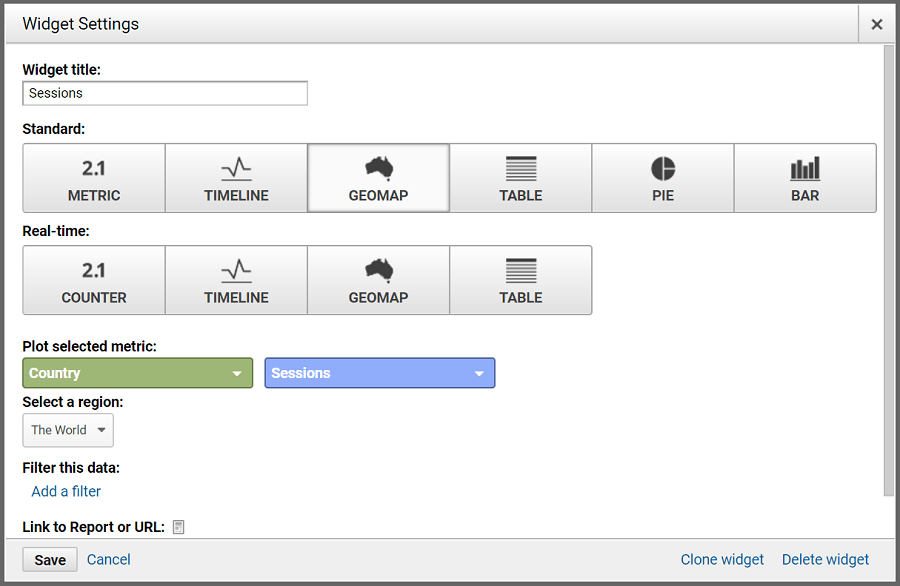
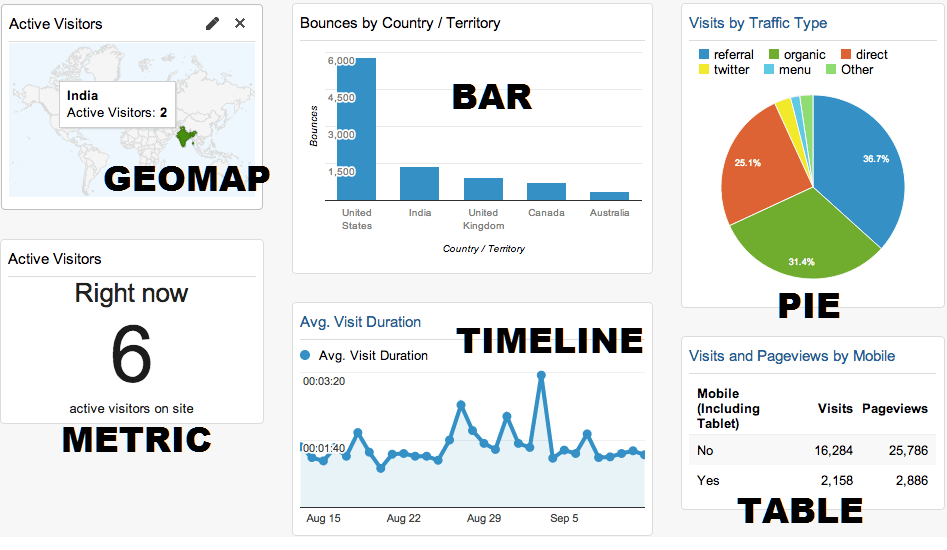
There are six modes of viewing your data. Use the example dashboard below to decide which is best suited for your purposes:
With each widget you edit, you’ll customize each of the settings to your preferences:
- Standard vs. Real-Time Widgets: Select the most appropriate for the metric and time period you want to track.
- Metrics: A drop-down box will display all the trackable metrics.
- Compare and Filter: Here’s where you can really nail down exactly what data from which sources you’d like to see in the widget.
- Link to Report or URL: When you need a detailed view of the widget, linking it to a relevant report will simplify the process.
Moving Things Around
Now that you have all your widgets configured you can change their positions. You can access layout options by clicking Customize Dashboard in the top right.

The following options will separate your page into the chosen column ratios:
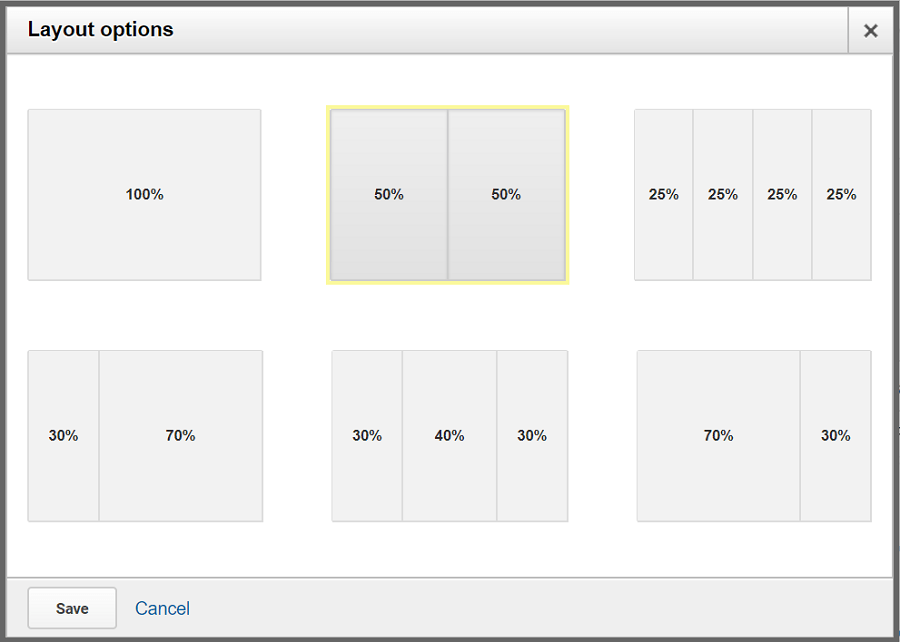
You can then simply click and drag each individual widget and drop them into your preferred positions. And voila! You have your very own customized Google Analytics Dashboard.
One Step Further: Segmenting
Your dashboards also allow you to segment your data. Want your dashboard to separately display the metrics of mobile-users to your site? Or track organic search traffic from Australia? No problem.
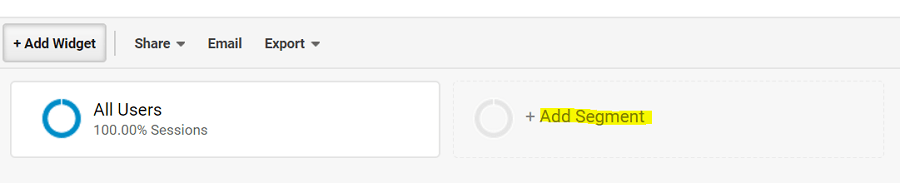
To do this, click the add segment button at the top of your dashboard:
From here, you can select from a list of predefined segments or create your own by clicking the red +NEW SEGMENT button.
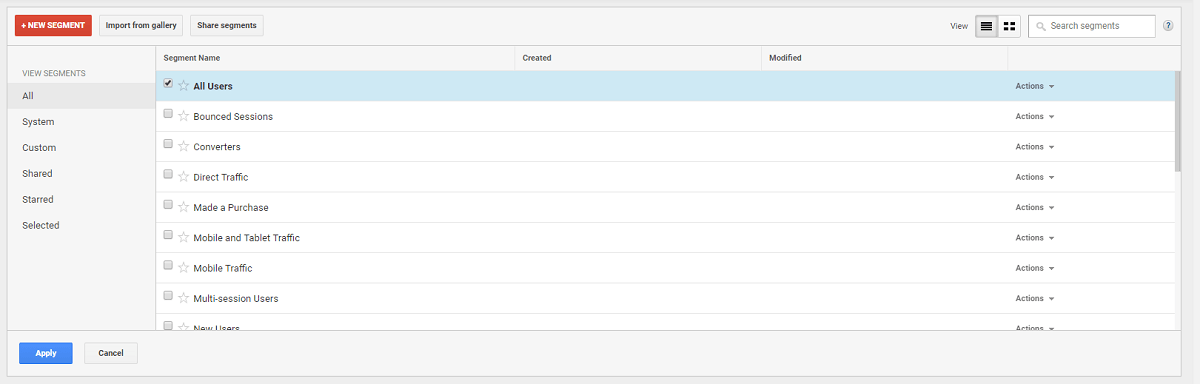
If you decide to create your own, you’ll be shown a screen that allows you to filter the segment by different categorical options:
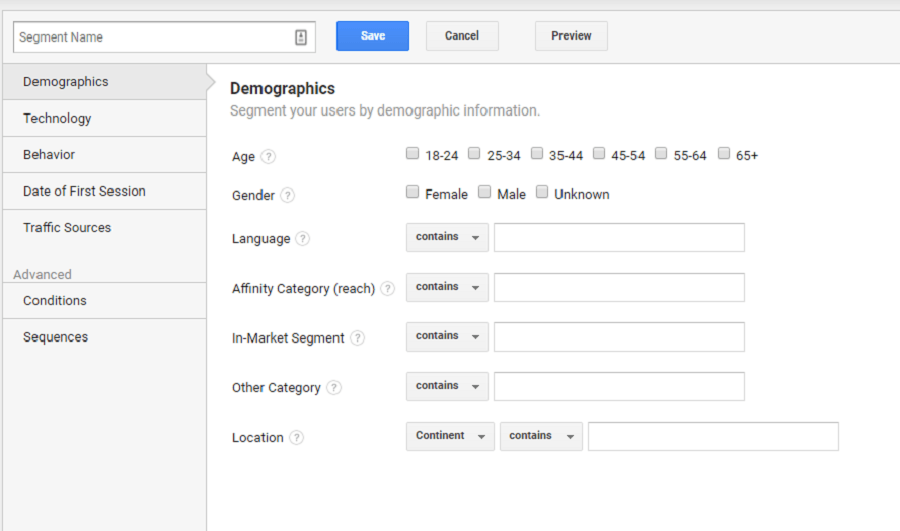
Make your selections, give it a name and hit Save. Now, each of your widgets will display data for all your selected segments.
Email Reports
Now that your data displays nicely on your shiny new dashboard, it’s time to set email reports. Why? Well, you could manually return to your dashboard every day to see stats. Or you could have them sent straight to your inbox.
If you’re more enticed by the latter, then click the Email button at the top of your dashboard.
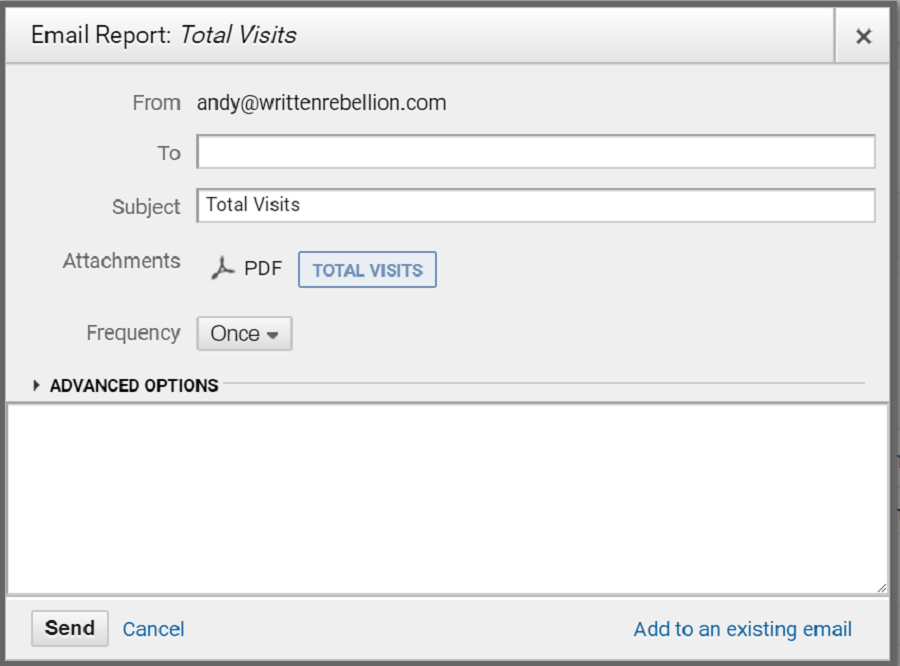
Set the recipients, frequency and day of the week you prefer and click Send. Now you’ll receive periodic updates on all your dashboard data.
Sharing is Caring
You’ve taken the time to build this dashboard specifically for your company’s goals. Naturally, you’d want to share it with other members of your team. Don’t worry – Google’s one step ahead.
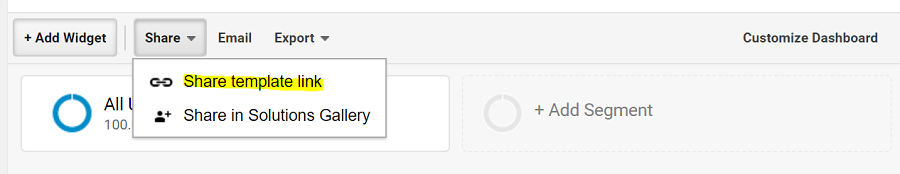
Click on the Share drop-down button at the top of your dashboard and select Share template link. This will generate a shareable link for your dashboard’s configuration.
The Power of Data Visualization
Your business is unique. Your data is unique. Dashboards are a way for you to see exactly what you need to track your goals. They are an easily-digestible, one-page summary of your data. Once you have them all set-up just the way you like – you’ll never want to look at data any other way again.
For more on how to get the most out of GA, read our guide on how to use Google Analytics in WordPress, and how to set conversion goals in Google Analtyics.