
Businesses and enterprises have a lot of data to contend with. From acquisition and retention metrics to prospective customers, internal business processes, partners, affiliates, and competitor data, knowing what data matters most to your business can be difficult.
Often, businesses can’t -or simply neglect to -leverage their data effectively into actionable wins that can grow revenue and help them operate more efficiently.
That’s where business intelligence (BI) tools can really help. They pull your data from dozens of sources, clean it up, transform it, and display it visually via dashboards and reports, which are far easier to interpret than raw numbers and fields. BI also makes it easier to track the ins and outs of what’s actually happening in your company.
While BI tools have been around for decades, there’s been an explosion of excellent online tools entering the market in recent years. These tools are constantly evolving to meet the ever-expanding and fast-changing needs of businesses of all sizes and niches.
But choosing a BI tool for the first time can be overwhelming -there are currently more than 100 vendors available.
Below, we’ve collected some of the highest-rated and most often recommended business intelligence tools for companies of all shapes and sizes, with options for both well-established enterprises and businesses that are just getting started.
Choosing the Right Business Intelligence Tool
Working out which tool is going to be right for your business comes down to a few key considerations:
1. Data Sources and Integrations
You need to ensure that the BI tool you go with can read all of your data sources and has all the integrations you need, particularly for popular sources like Salesforce, Quickbooks, Google Analytics, and your customer database(s). Because if it doesn’t, you won’t get the specific information you need.
2. Data Cleanup
Inevitably, data will be dirty when you first collect it. There’ll be missing fields, or fields that contain inconsistencies. There’ll probably also be spelling errors and values that don’t make sense.
Cleaning up data can be a hugely time-consuming process. So keep this in mind when looking -you want a solution that can do the cleanup for you, and do it with some level of automation.
3. Data Analysis
Obviously, you’ll want to be able to easily read and analyze your data. But beyond that, you’ll want to have the ability to analyze historical trends and really dig in to your data to understand different aspects of your business, and build models to test new ideas.
Some businesses might even want the ability to predict future performance based on statistical models and, potentially, machine learning models.
4. Flexible Dashboards, Charts, and Reports
Through the use of data visualizations, dashboards simplify complex data sets to provide users with at-a-glance awareness of current performance. BI tools differ hugely in the flexibility and design of the dashboards they provide, along with the numbers of chart types they offer and the reports they can generate.
You’ll want dashboards that you can tailor not just for an executive overview of what’s happening with your business, but for different parts of your organization, from marketing and sales to support and finance.
5. Ease of Use
You don’t want a BI that’s overly complicated to use and requires expertise in statistical analysis. So before you commit to a particular tool, try out a bunch. Take note of the user experience -what you like and don’t like. Involve people in your business with different skill sets, who would potentially be using the tool, and ask for their feedback.
6. Collaboration
Data is most powerful when your whole company can rally around metrics that matter, but thats hard to achieve when only a handful of people have access to those metrics. So be sure to investigate whether you can share with other users, and how many, and whether there are options for different user roles.
Your decisions around collaboration will ultimately impact cost.
7. Cost
Many BI software companies don’t list their prices on their websites; they tell you to get in touch for a quote. There’s a legitimate reason for this, given that BI tools are often not a one-size-fits-all solution and need to be customized to be useful.
But this lack of clarity is still frustrating.
BIME, for example, has a $490-per-month base plan for two users, and adds $90 per month for each additional user. Meanwhile, Grow charges by the number of metrics you want to use and track, rather than by the number of users.
9 Business Intelligence Tools
1. Grow
Price: Determined according to business need, pricing quotes are available upon request. While researching for our own BI tools at Pagely, we were quoted $500 per month.
Best for: Mid- to large-sized companies and enterprise businesses that want a better way to visualize their data and need help with setup.
With more than 150+ integrations, including everything from Asana to Dropbox, Facebook, Google Analytics and, of course, HubSpot, Grow stands out with support for lots of data sources and lots of chart types (300+ pre-built reports, in fact).
Grow promises to implement 8x faster than competitors so you can hit the ground running, which I’d say is a fairly accurate assessment. The analytics are fully customizable and offer real-time updates, letting you mash up and compare your data from lots of different sources on one easy to monitor dashboard.
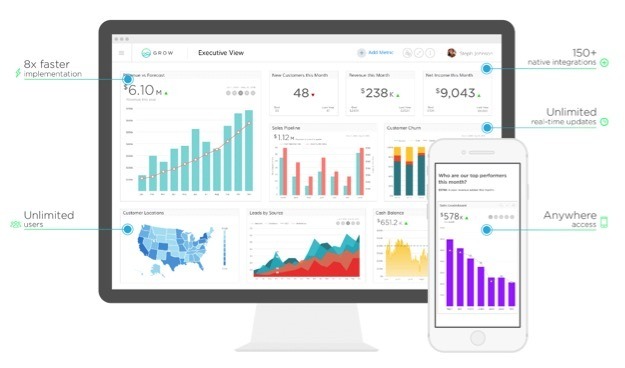
Another plus is that you don’t need to be a data expert to use it. Grow takes care of all the data cleanup, pivoting, grouping, filtering, and applying formulas and functions, so you can track what’s most meaningful to your business.
Grow is a fantastic and capable BI system, and I know because it’s what we originally decided to use at Pagely. In part, Grow was so attractive to me as a marketer because most of the other BI tools we investigated had overly complex setups. Grow walked us through the setup process, creating many of the initial reports for us.
2. Domo
Price: The Standard plan is $83 per user per month. The Professional plan runs $160 per user per month. The Enterprise plan is $190 per user per month. Free trials are available.
Best for: Domo is a heavy-duty product for companies serious about data.
Domo brings together a huge assortment of data connectors, i.e. integrations. There are 450+, in fact, including Salesforce, AWS, Asana, GitHub and Google Analytics -pretty much anything you can think of. Domo says its customers connect to thousands more custom data sources.
Domo also provides a unified data store, a huge selection of visualizations, integrated social media, and comprehensive reporting. Domo’s self-service ETL (Extract, Transform, and Load) toolkit, Magic, provides dynamic data transformation capabilities for users of all skill levels. There’s also Buzz, a collaboration tool for assigning and coordinating work around data in your organization.
Another nice touch is the Domo app store, which provides apps for even more visualizations.
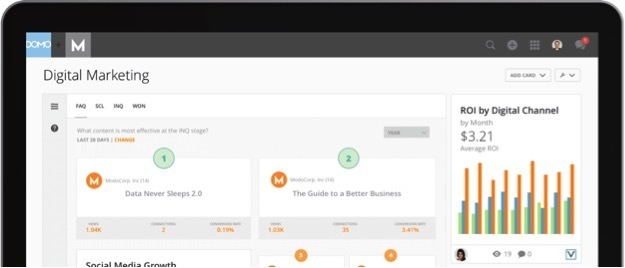
Here’s what the Domo marketing dashboard looks like:
3. BIME
Price: The Base plan is $490 per month and includes 45+ connectors. The Big Data plan is $690 per month and includes the features of the Base plan plus access to SQL DB connectors like Amazon Redshift, Google BigQuery, MongoDB, and more. Two user licenses are included with each plan. Each additional user is $90 per month, and each additional viewer is $9 per month.
Best for: Small, medium and large companies. BIME is widely adaptable.
With 65+ data connectors, BIME’s BI tool offers the ability to track all kinds of data (flat files, CRM, web apps, and databases), transform your data into meaningful metrics and attributes, and presents analytics beautifully with 25+ data visualization tools. Customizable dashboards let you add images and choose from 100+ icons, allowing you to present data tables as charts that are impactful and interactive.
A useful Salesforce and BIME integration for support teams lets you track the entire user journey from prospect to customer to churn. There are also out-of-the-box tools, such as a forecasting feature that can predict future values based on your current data set.
4. ChartMogul
Price: ChartMogul is free for small companies and costs $125 per 1,000 customers per month once you generate more than $10,000 in monthly recurring revenue.
Best for: Subscription-based SaaS companies.
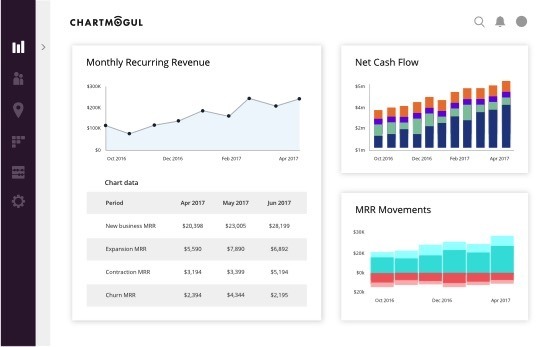
Unlike the other options on this list, ChartMogul has been built specifically for SaaS companies that run on subscriptions. With this tool, you can keep an eye on your monthly recurring revenue, watch your net cash flow, calculate the average revenue per customers, and generate cohort analytics to look at churn over time.
Here’s what ChartMogul looks like:
You can connect ChartMogul with Stripe, PayPal, and many other payment services. It can also automatically retrieve all your payment data and process it, as well as manually import CSV files. ChartMogul also lets you associate names and orders with payment IDs. This allows you to enrich your data through integrations with Intercom or MailChimp, for example, and know who is paying for what. It’s also possible to segment customers and target them with customized emails to woo back those who churn.
5. Looker
Price: Determined according to business need, pricing quotes are available upon request. We were quoted $3,000 per month.
Best for: Small, medium, and large business analyst teams that want powerful access to their data.
Looker is an incredibly compelling BI option for one single reason: its data modeling layer, LookML. The language operates like a simplified version of SQL, which is reusable and modular, and in turn, way easier for first-time users to learn. This fundamental innovation provides tools for building sophisticated analytics, which can then be pulled into easy-to-build reports. This powerful combination is what BI tools strive to provide, and Looker does it better than anyone else.
Here’s Looker:
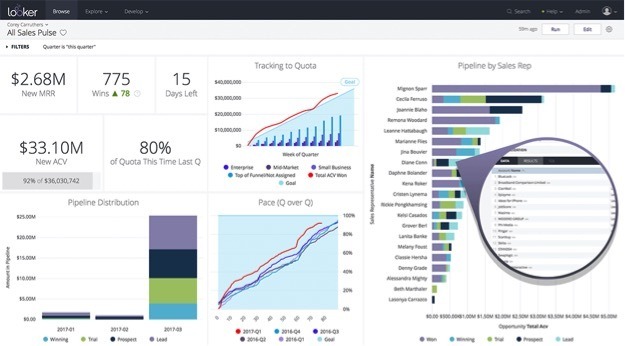
Compared to other BI tools, Looker lacks customization and visualization features, providing only fairly basic graphing and data manipulation features. However, it makes up for these drawbacks with its powerful data integrations (like Redshift and Aurora), intuitiveness for business users, and excellent support.
6. Tableau
Price: Tableau Desktop Personal Edition is $35 per user per month and connects to files like Excel and Google Sheets. The Professional Edition is $70 per user per month and includes integrations with web applications and more.
Best for: Small, medium, and large businesses that want intuitive data visualization and analytics.
Tableau is a pioneer of drag-and-drop analytics -it was among the first BI systems to offer intuitive dashboards where users could manipulate data via drag-and-drop. With its customizable dashboards, Tableau lets users easily create, publish, and share dashboards without touching code. It can also connect to dozens of data sources, including Amazon Aurora and Redshift, Google Analytics, and Azure.
There are three different Tableau products: Tableau Desktop, Tableau Server and Tableau Online. Tableau Desktop is the primary product and data visualization tool. Tableau Server comes with all the features of Tableau Desktop and adds networking capabilities, while Tableau Online is a hosted version of Tableau Server.
Here’s what the Tableau Desktop dashboard looks like:
7. Slemma
Price: The Basic plan is $29 per month) for three users, the Small Business plan is $99 per month for 10 users, the Standard plan is $199 per month for 30 users, and the Client Reporting plan is $599 per month for 80 users. A free trial is available.
Best for: Small to medium-sized businesses that want a solution that is relatively easy to use and implement.
Slemma is a powerful reporting and BI tool that lets you easily create dynamic dashboards from multiple data sets. It connects to 75+ services and tools (including Amazon Redshift, Google Analytics, Intercom, Azure SQL, Oracle and more). There’s also a step-by-step chart designer that makes report generation quick and painless with pre-built templates, allowing you to visualize your third-party data in minutes.
With Slemma, you can analyze, collaborate, and securely distribute dashboard insights internally or with clients. A dashboard library lets you hit the ground running, with dashboards for popular tools like Hubspot, Salesforce, and Google Analytics. While Slemma lacks the data power of some of the bigger BI players, it makes up for it with ease of use and report creation.
Like all these tools, you can also access Slemma on mobile devices.
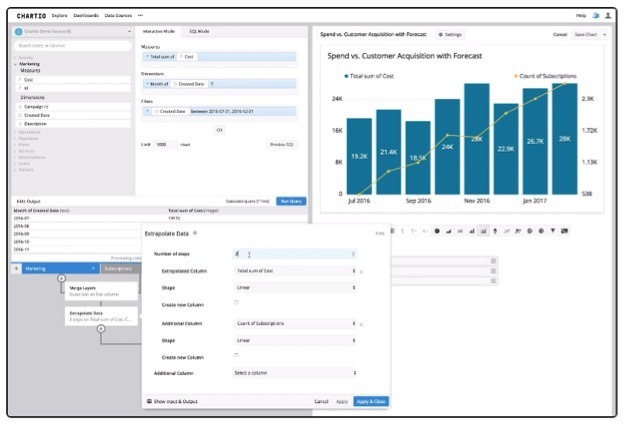
8. Chartio
Price: Determined according to business size, pricing quotes are available upon request. Free trials are available.
Best for: Small, medium, and large businesses. Chartio scales with your company.
Chartio provides cloud-based data exploration designed to be usable by anyone, so that business users don’t have to rely on analysts for answers. But if you are an analyst, there are powerful features available with SQL and interactive query modes. For business teams, Chartio enables you to create self-service interactive dashboards for marketing, sales, and support teams that pull data from every function of your company.
There are out-of-the-box connections to your data sources from Amazon Redshift to CSV files, so you can start exploring data immediately. There’s also a chart builder that lets you easily query data using a drag-and-drop query generator or a SQL query editor. The provided charts are very well designed, flexible, and smart, so they fit the data being fed to them.
Here’s what Chartio’s dashboard looks like:
9. Sisense
Price: Determined according to business needs, pricing quotes are available upon request. Free trials are available.
Best for: Small, medium, and large organizations. Sisense is ideal for data-crunching beginners, but also provides powerful features for companies at scale.
Sisense is the only BI system I’ve come across that offers a test-drive for prospective clients – a 90-minute trial using your own real data. The best way to take advantage of this is with an actual business case, which they will solve during the demo.
It’s safe to say Sisense is customer-focused. Not only is their customer support top-notch, the platform is built with non-technical users in mind. So the vast majority of what you’ll want to do can be achieved via a simple drag-and-drop interface. That’s not to say power users are neglected – SQL and advanced functionality are also available.
Here’s an example of what a help desk ticket dashboard looks like:
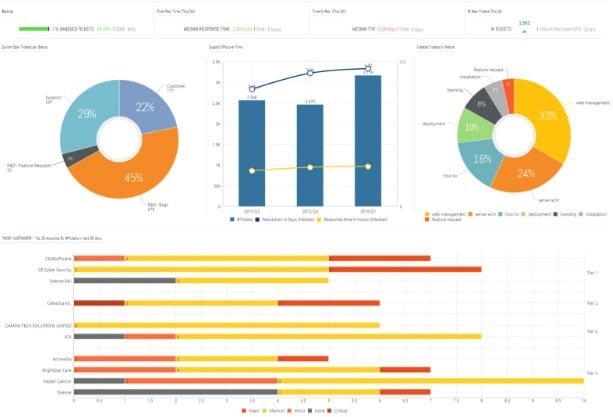
One of Sisense’s core features is its “in-chip” back-end technology, which maximizes the way existing resources, including RAM and CPU, are used on a user’s computer to allow your system to do more with less. According to Sisense, this allows the platform to work with 100 times more data at 10 times the speed. In practice, this makes it easy for data-newbies to join complex data from multiple sources, build interactive and business intelligence reports, and share it all in one click.
What are your favorite business intelligence tools? Share with us in the comments